Enterprise Platform Redesign & AI Integration
Improving B2B Platform Efficiency & Data-Driven Decisions
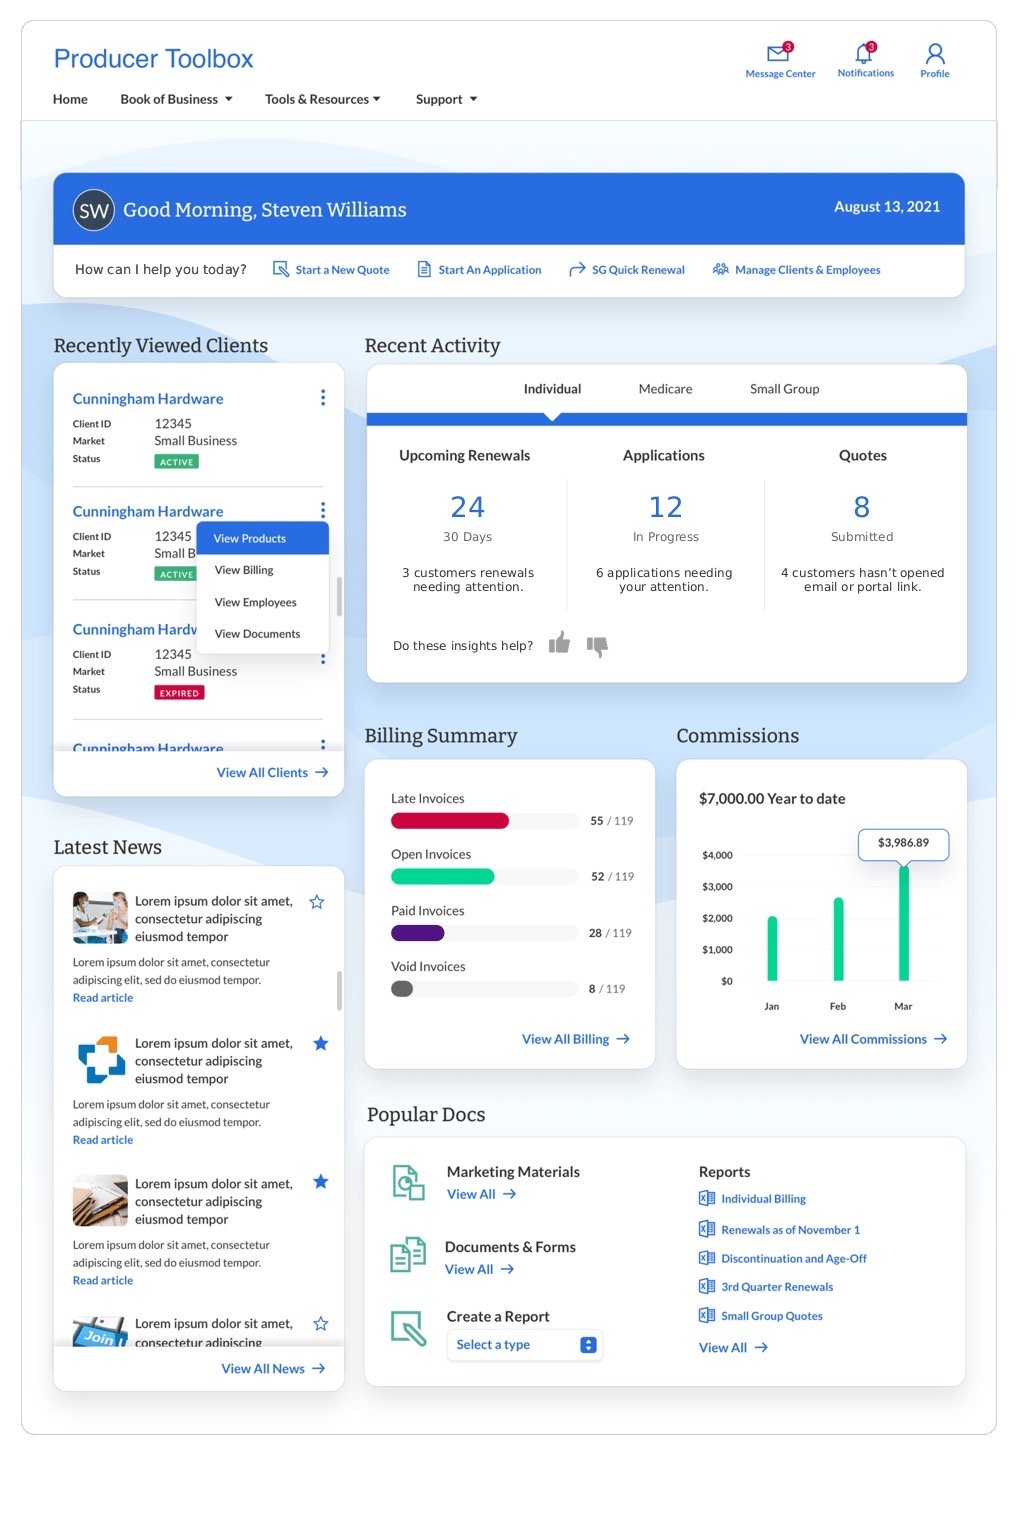
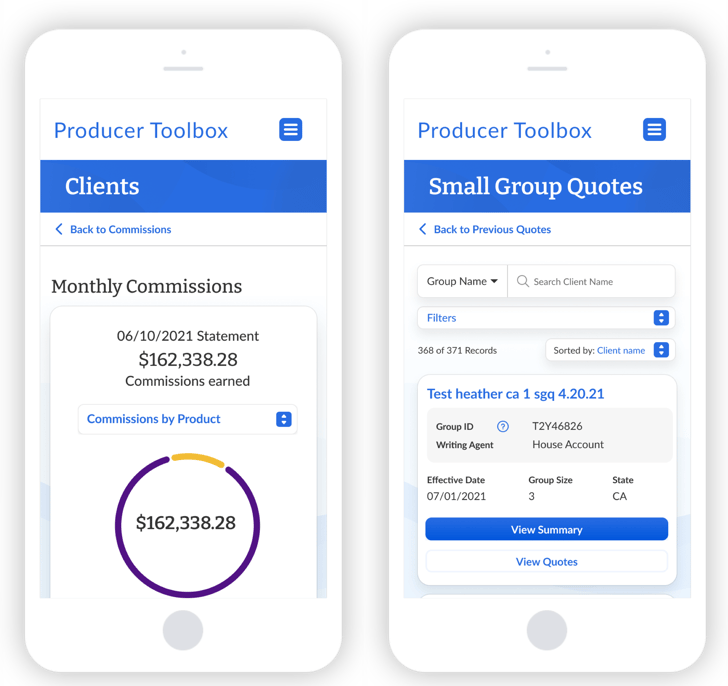
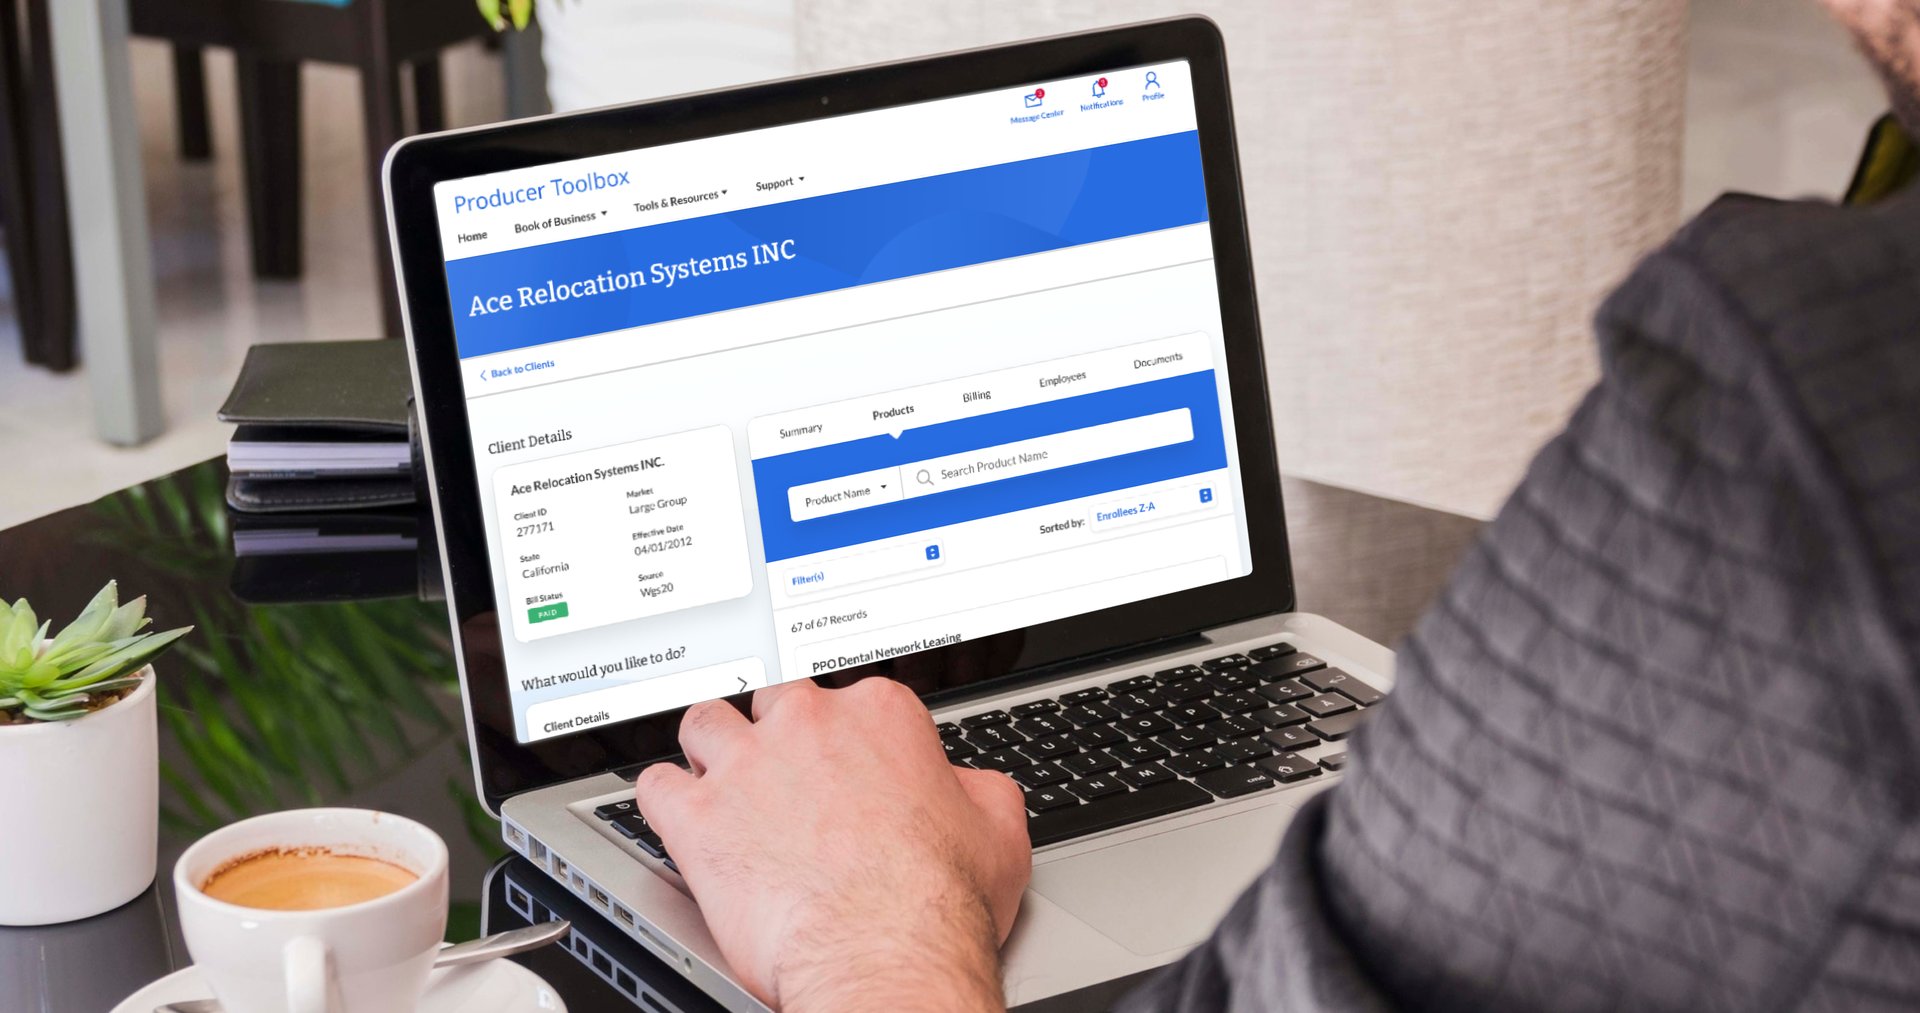
Producer Toolbox is the enterprise portal used by 2,000+ brokers to manage clients, quotes, and commissions. The company’s goal was to provide a single source of truth that streamlines workflows, reduces errors, and enables data-driven decision-making at scale. Existing inefficiencies in navigation and inconsistent UI were slowing brokers, increasing training costs, and limiting adoption of critical analytics dashboards.
As Principal Product Designer, I led a strategic redesign to transform the portal into a streamlined, high-performance tool. By focusing on user workflows, data-driven insights, and intuitive navigation, the redesign aimed to boost broker productivity, improve decision-making, and deliver measurable business outcomes.
The Problem
Context & Challenges:
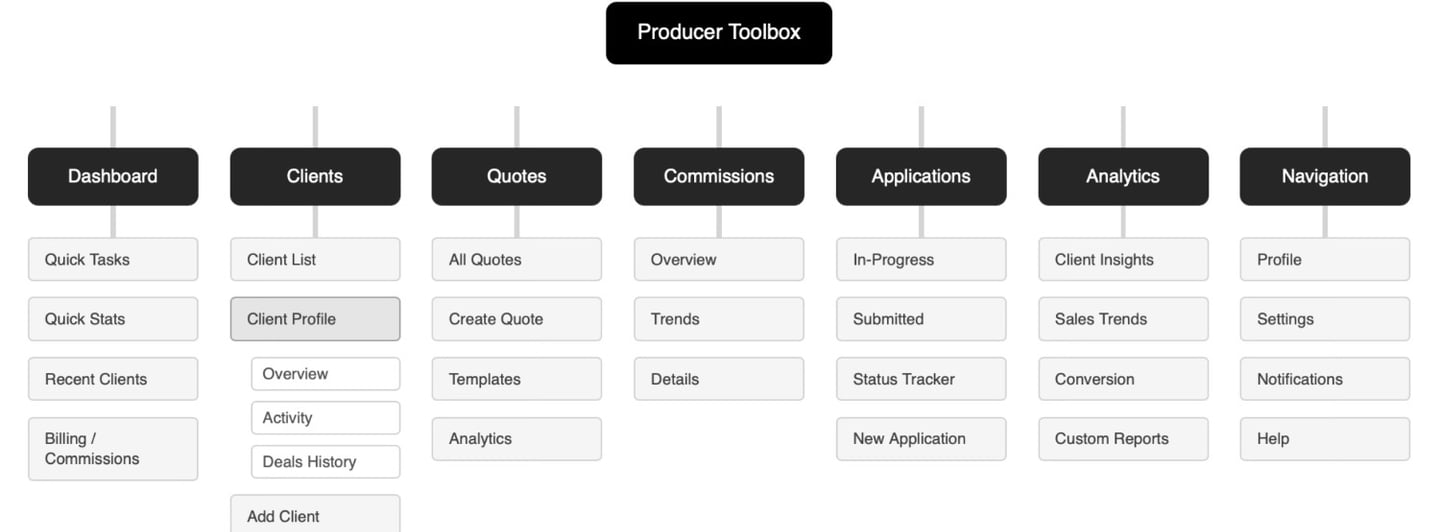
Brokers struggled to navigate nested menus, locate client information, and trust analytics dashboards. These inefficiencies created friction in decision-making, slowed workflow, and limited the firm’s ability to leverage insights effectively. Without a scalable design system, UI inconsistencies further frustrated users and amplified operational risk.
Why It Mattered:
Inefficient workflows directly impact business outcomes. Slow or error-prone access to client data reduces broker productivity, increases mistakes, and risks lost revenue opportunities. Low adoption of dashboards prevents informed decision-making and increases support costs. By solving these issues, the redesign could unlock broker efficiency, improve decision-making, and enhance revenue impact.


UX Strategy & Design Approach
My approach focused on outcome-driven design, with strategy informed by both research and enterprise needs:
User-Centered Research: Conducted interviews and analyzed workflow analytics to identify pain points and priority areas.
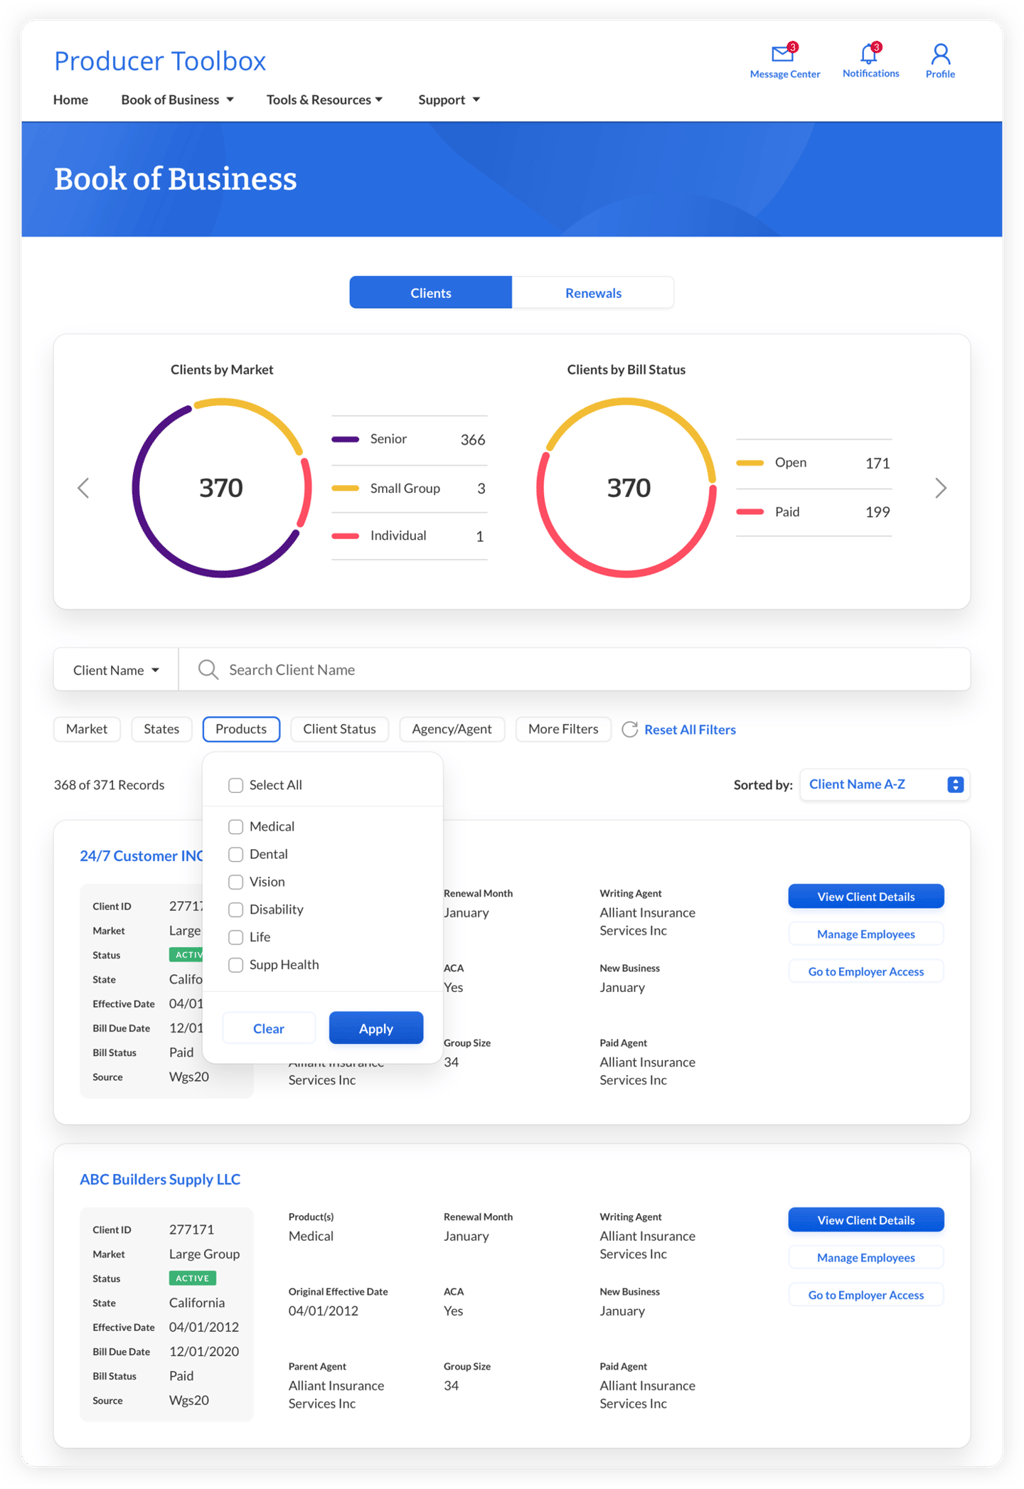
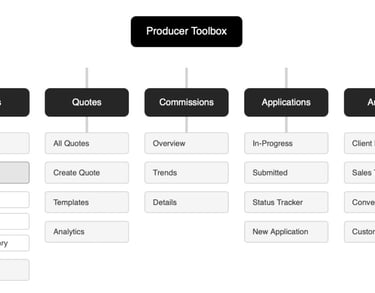
Information Architecture Overhaul: Simplified navigation and created clear paths for core broker tasks.
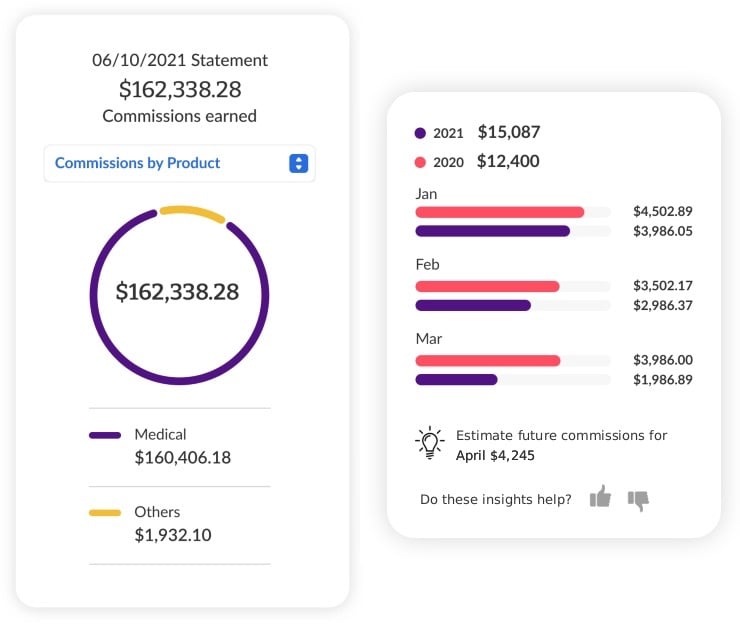
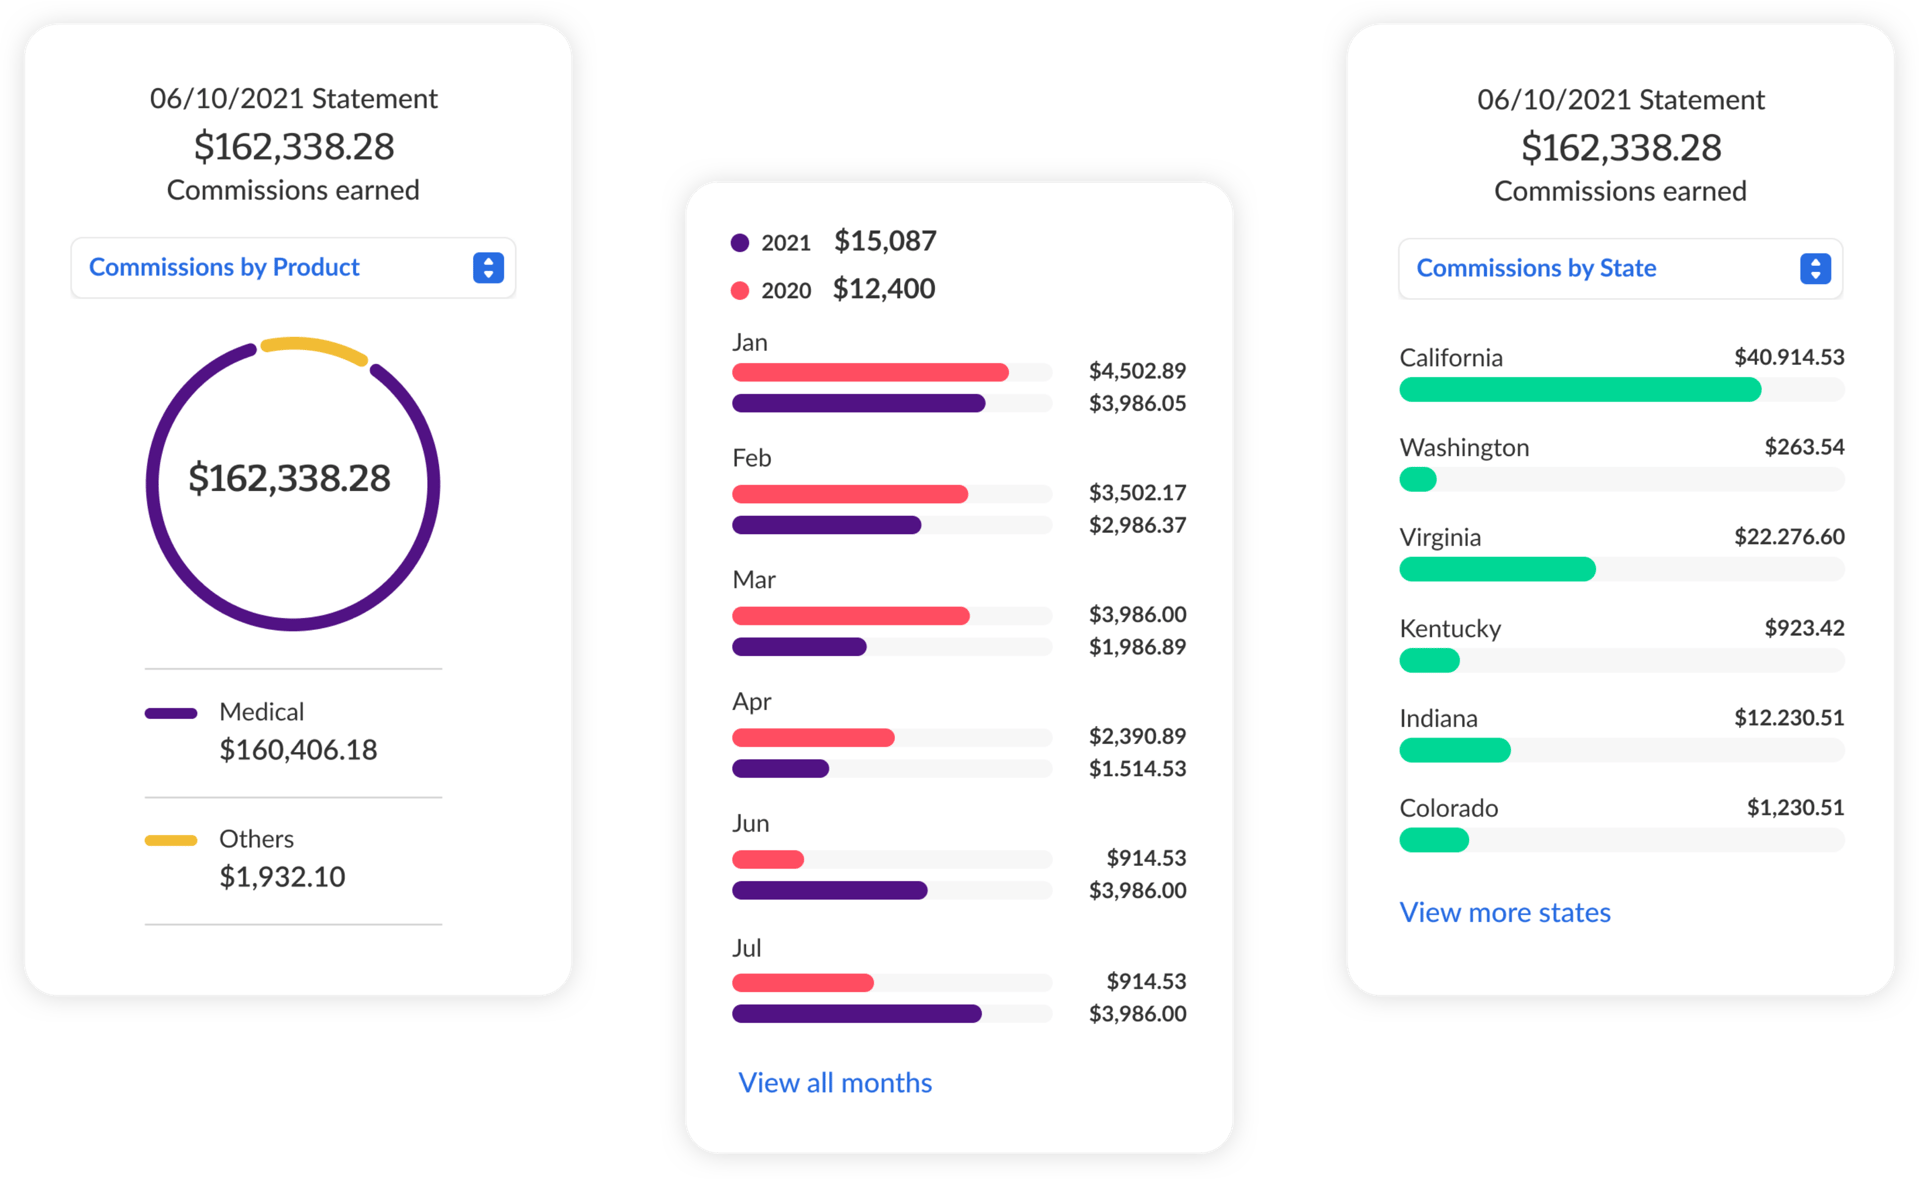
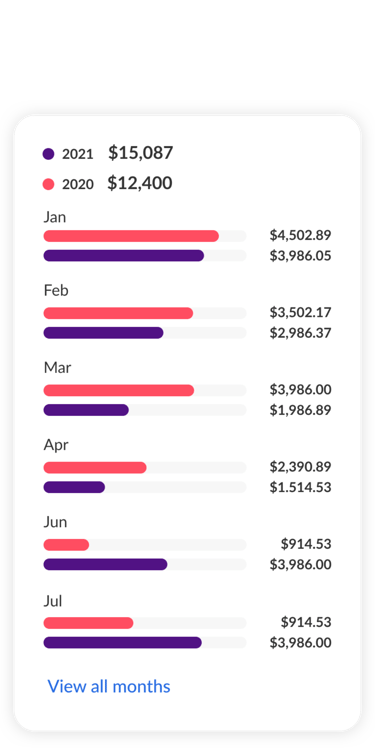
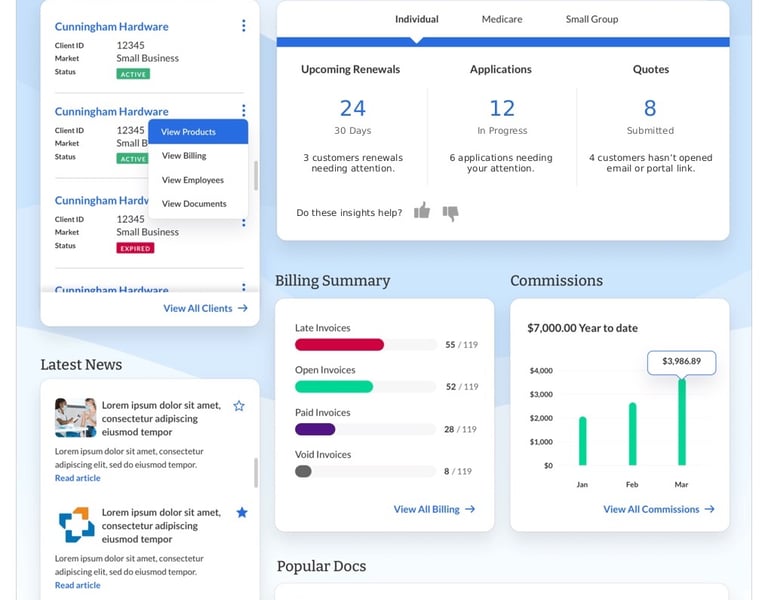
Actionable Dashboards: Designed interactive charts and quick-glance insights for faster, data-driven decisions.
AI & Data Integration: Predictive dashboards highlight clients or accounts requiring attention, automated suggestions reduce manual entry, and actionable analytics guide brokers to high-impact decisions. This reduces errors, accelerates workflows, and increases adoption of analytics tools.
Iterative Prototyping & Testing: Low- and high-fidelity prototypes were tested with brokers to refine usability and balance depth for power users with simplicity for new users.
Scalable Design System: Introduced reusable components to ensure consistency, faster development, and long-term scalability.

Implementation & Collaboration
I partnered closely with PMs, engineers, and stakeholders to ensure the redesign was both strategic and executable:
Component Guidelines: Introduced a scalable design system that reduced dev time by 20% and ensured consistency across modules.
Workshops & Alignment: Led cross-functional workshops to align on workflows, KPIs, and design priorities.
Iterative Feedback Loops: Implemented regular design reviews with brokers and internal stakeholders to validate features before release.
Handoff Optimization: Streamlined design-to-engineering handoff using detailed specifications, annotations, and interactive prototypes, reducing rework and delays.
Key Challenges & Trade-offs
Balancing simplicity for new vs. pro brokers.
Conflicting feedback between business and marketing, and making design decisions that balanced all interests.
Maintaining data accuracy while simplifying dashboard visualizations.
Minimizing friction for brokers accustomed to the old system while introducing new workflows and AI-enabled analytics.
Adapting design decisions to accommodate legacy backend systems without compromising the user experience.

Outcome & Impact
These results demonstrate how strategic UX, AI insights, and streamlined workflows can directly drive broker productivity and business success.


Faster Ramp-Up for New Users
25% reduction in onboarding time for new brokers
Reduced Workflow Friction
20% fewer navigation errors
Accelerated Client Insights
48% faster access to client summaries
Smarter, AI-Enabled Workflows
AI-driven insights empowered brokers to prioritize high-impact accounts and reduce repetitive work

Reflections & Learnings
This project reinforced that strategic UX in enterprise software is measured by outcomes, not just screens. By focusing on user workflows, business KPIs, scalable systems, and AI-enabled insights, we improved adoption, efficiency, and decision-making across the organization—turning design into a measurable business lever.
Outcome-Driven Enterprise Design
A streamlined, AI-enabled broker portal designed to accelerate workflows and drive measurable business impact.